Dec 2025 · 8 min · Teaching
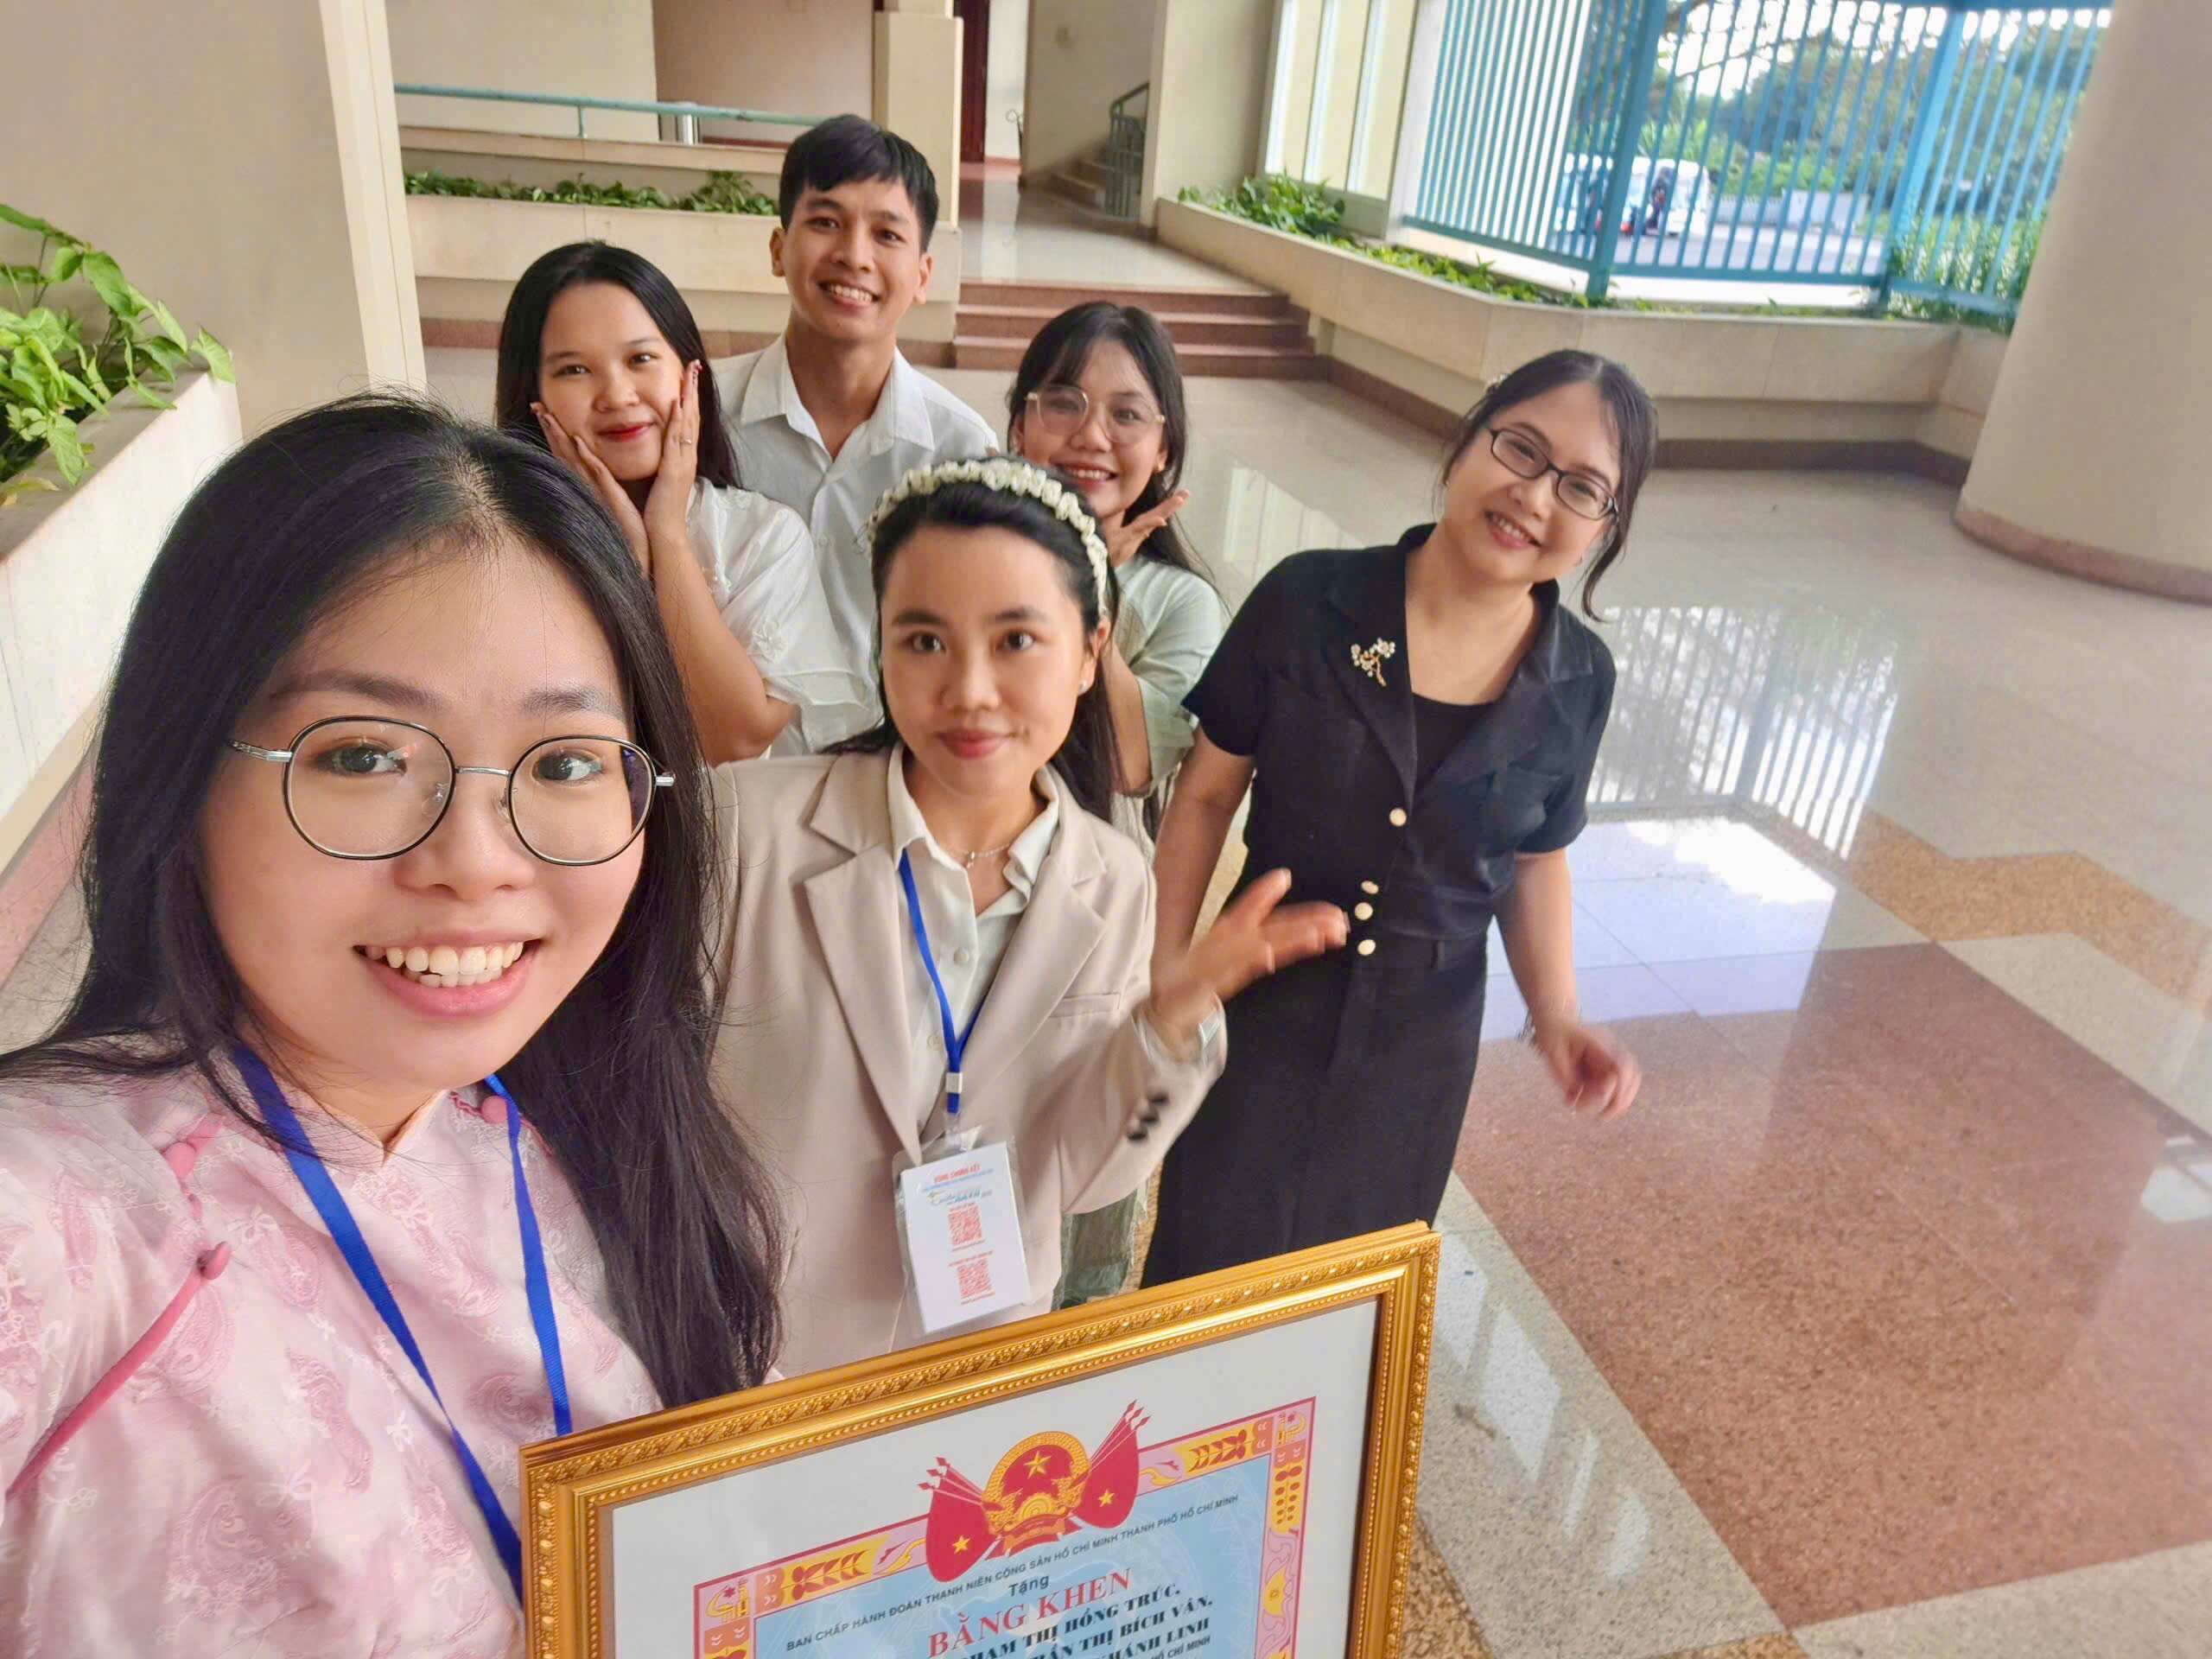
On being a mentor
Notes from the Leadership program at HCMUS — and what it taught me about getting out of the students’ way.
I explore the intersection of science, data and technology to make complex things simple and meaningful.
2017 – present
Early signal-processing work in Vietnam — QRS in ECG at IEEE ICIEA, then EEG with neural networks at NAFOSTED NICS. The start of a fascination with biomedical signals.
Crossing the Pacific to Texas Tech. A new chapter at the HPC center — HiperViz for live CPU-temperature visualization, plus first VR explorations of multidimensional data.
A burst of visualization work: TimeRadar, JobNet, VixLSTM, HMaViz. Each one a different way to give shape to data.
Third place at the IEEE SciVis 2023 contest for PlastiVis, visualizing synaptic networks — a fitting close to the Texas Tech years before the road home.
Back home at VNU-HCM — teaching the next generation, leading an MRI brain-imaging grant, and building Physoom to run the faculty.
My research lives at the intersection of visual analytics, biomedical signal processing, and machine learning.
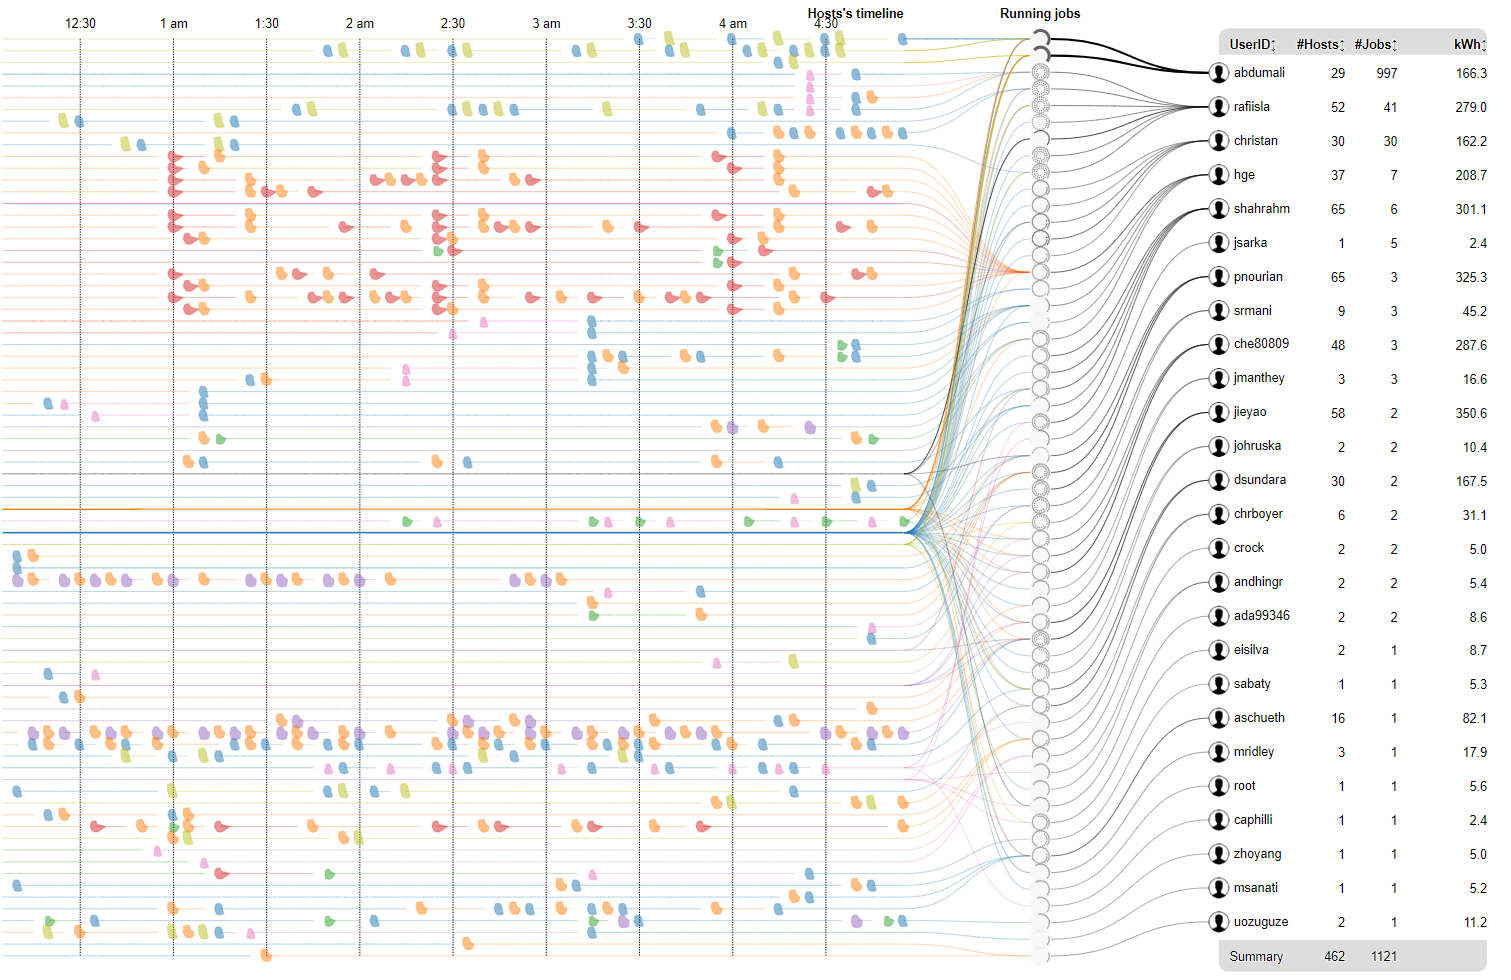
A radial timeline view for tracking the evolution of multivariate communities over time.
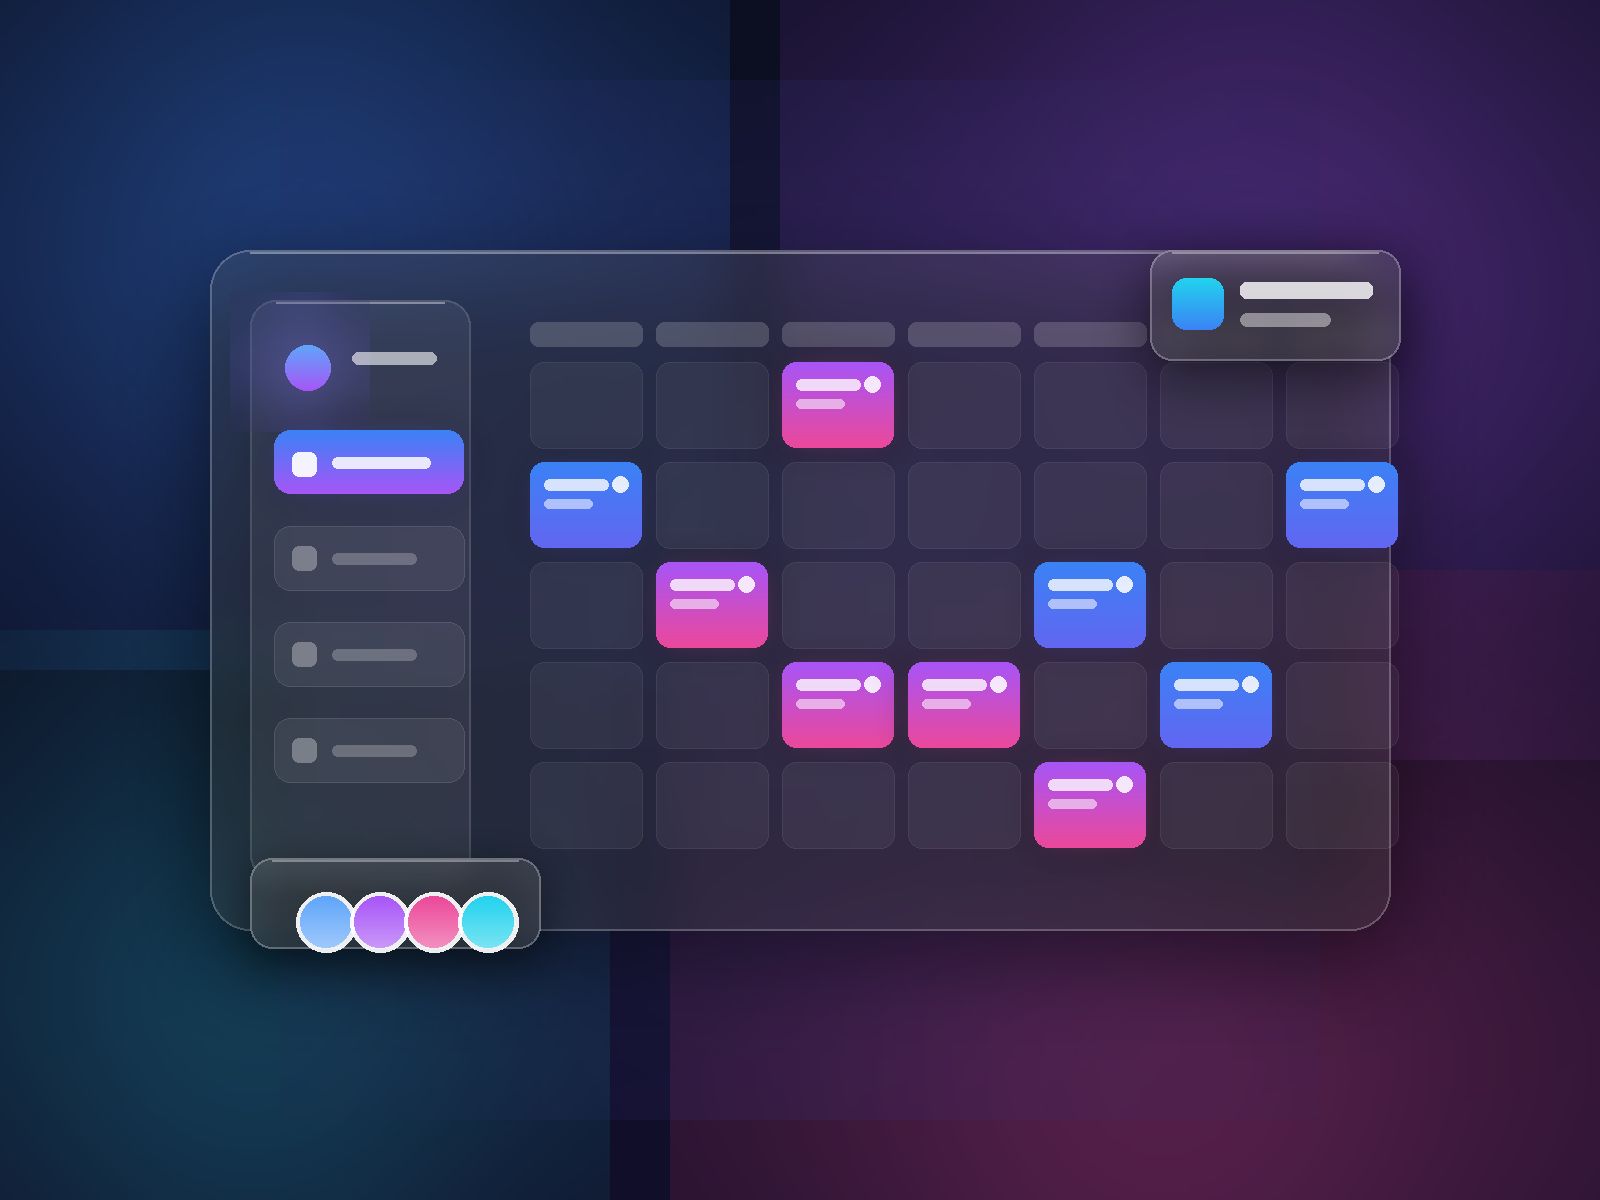
A lean, copyright-registered web platform for managing lecturers, rooms, and class schedules at the Faculty of Physics.
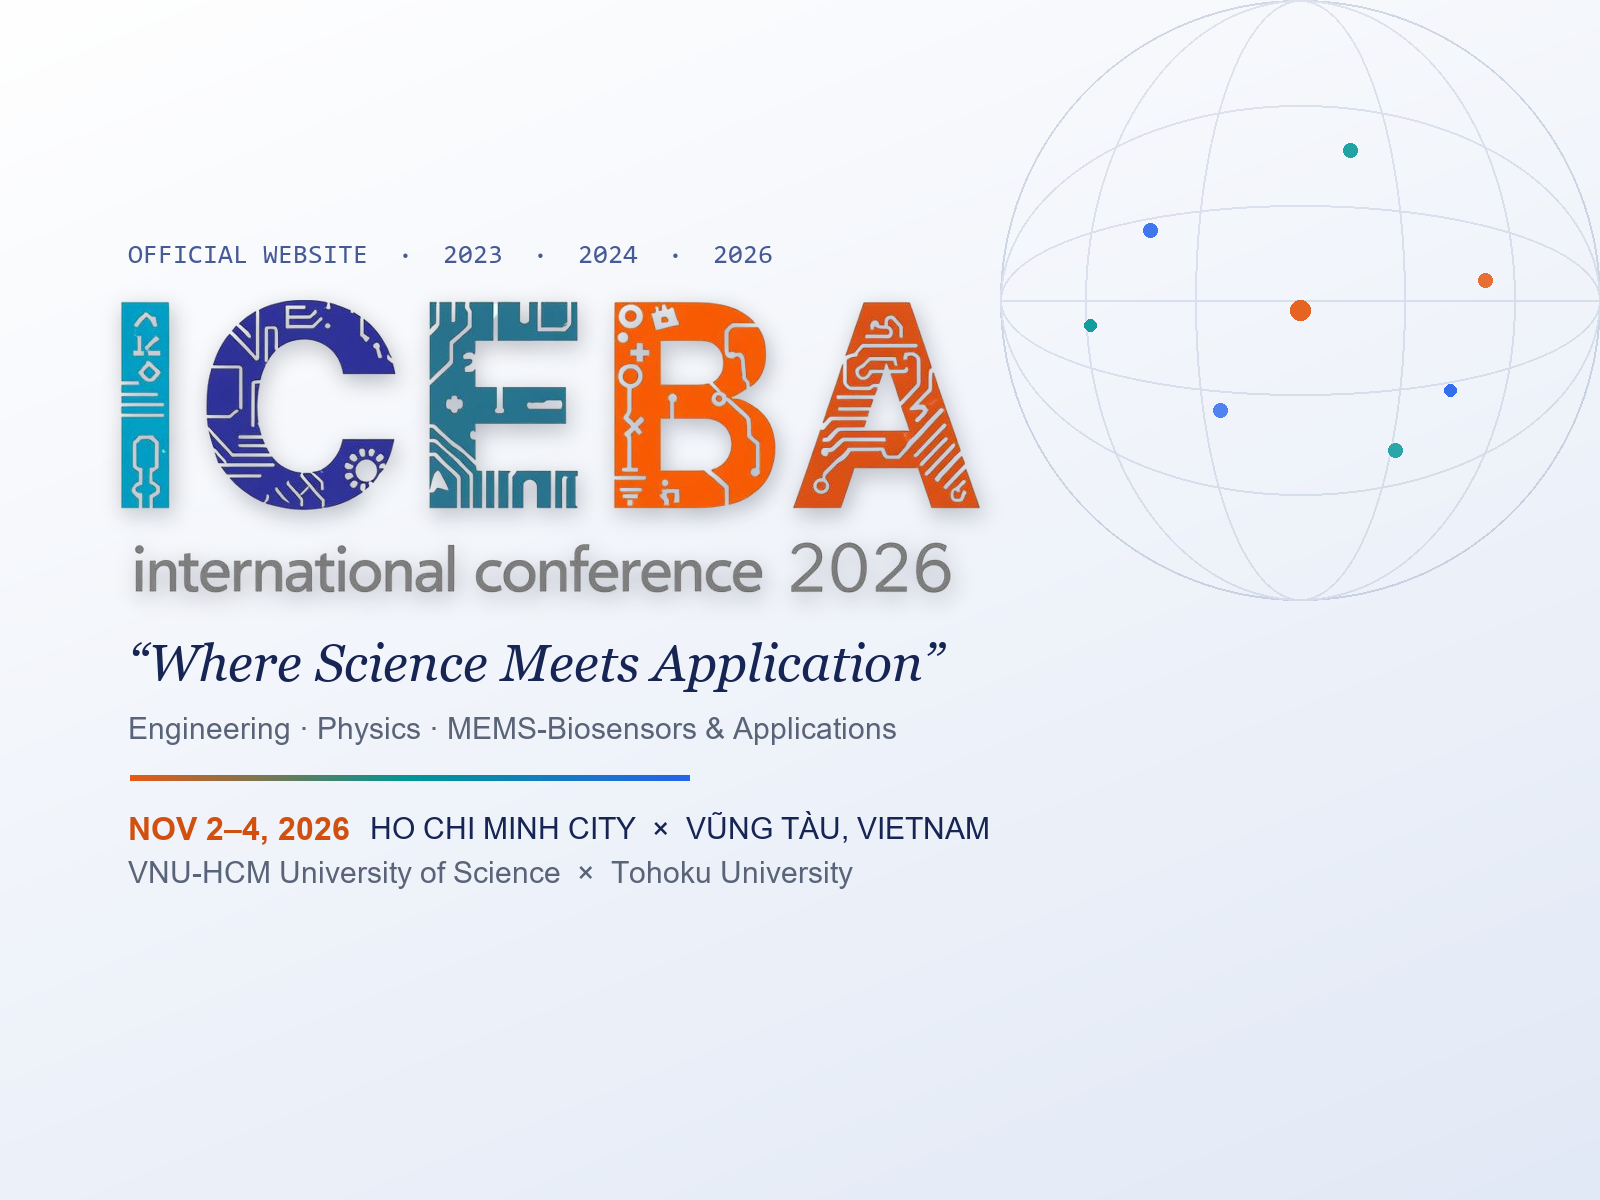
The official website for the ICEBA conference on Engineering, Physics, MEMS-Biosensors & Applications — built and maintained across its 2023, 2024, and 2026 editions.
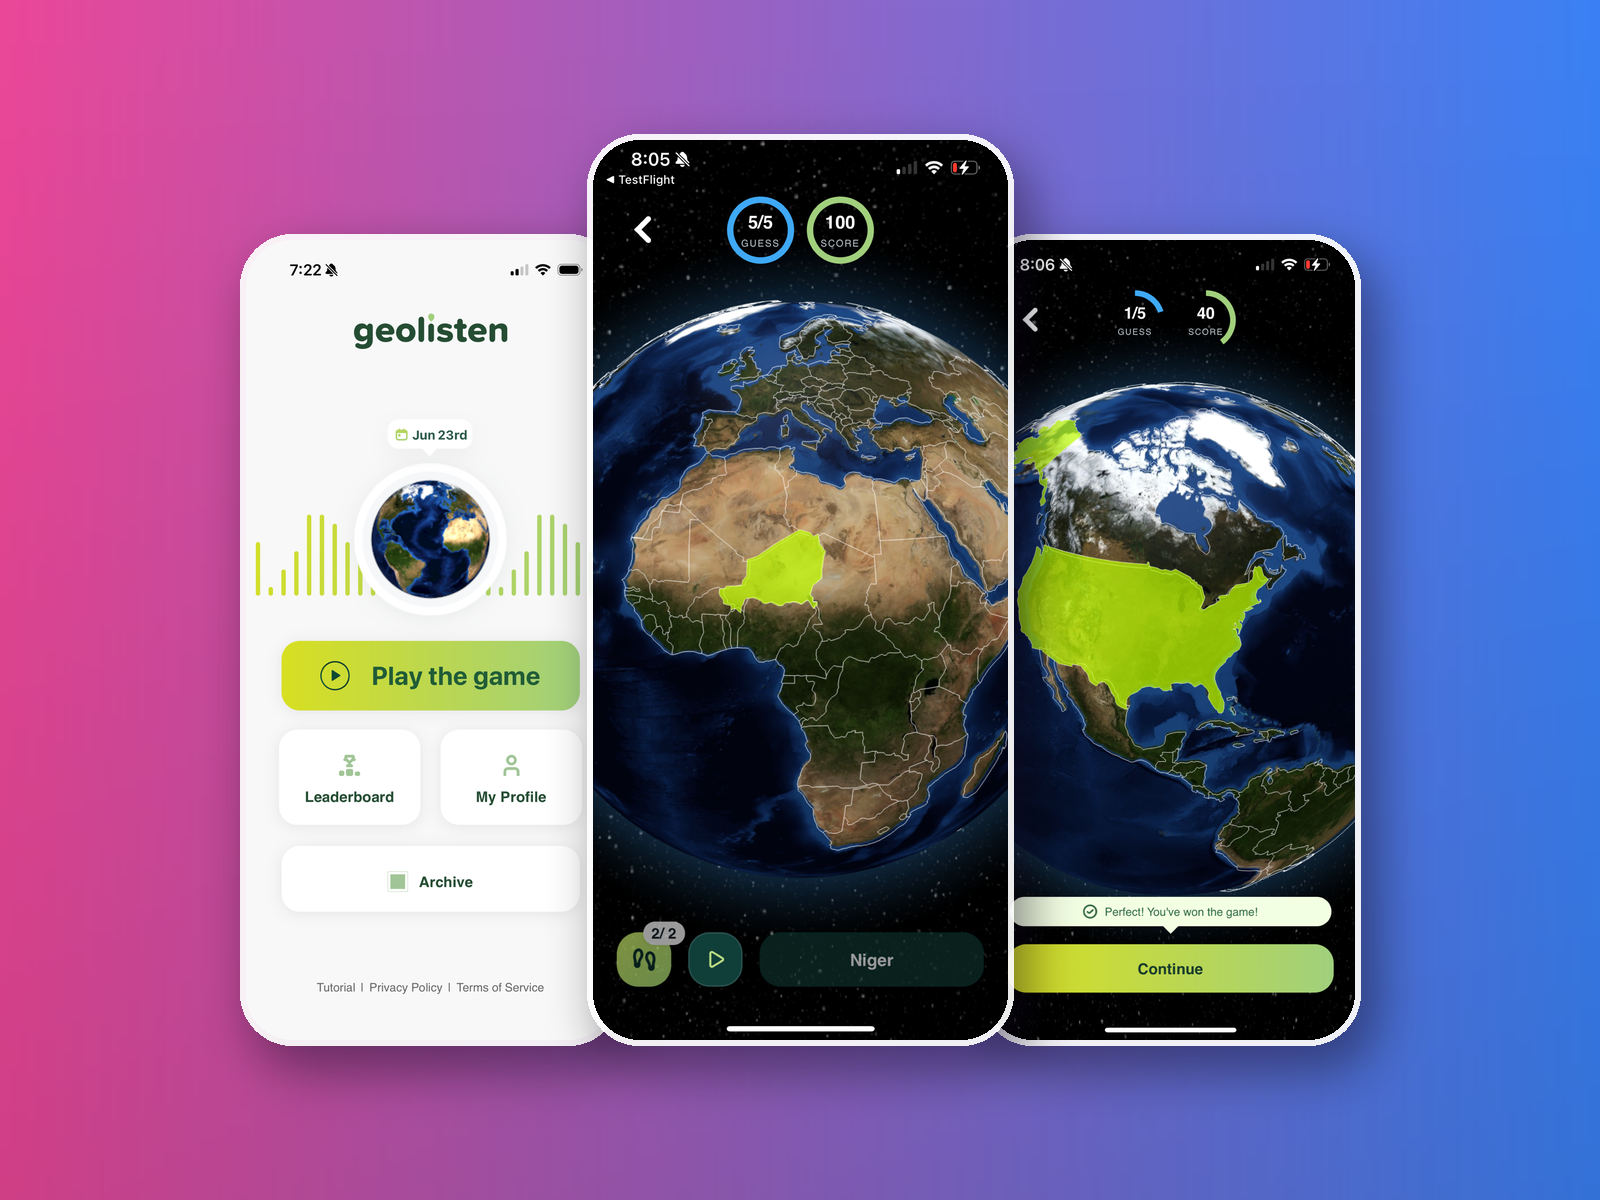
A daily music-meets-geography puzzle: hear a track, guess where in the world it comes from. I am the technical lead.
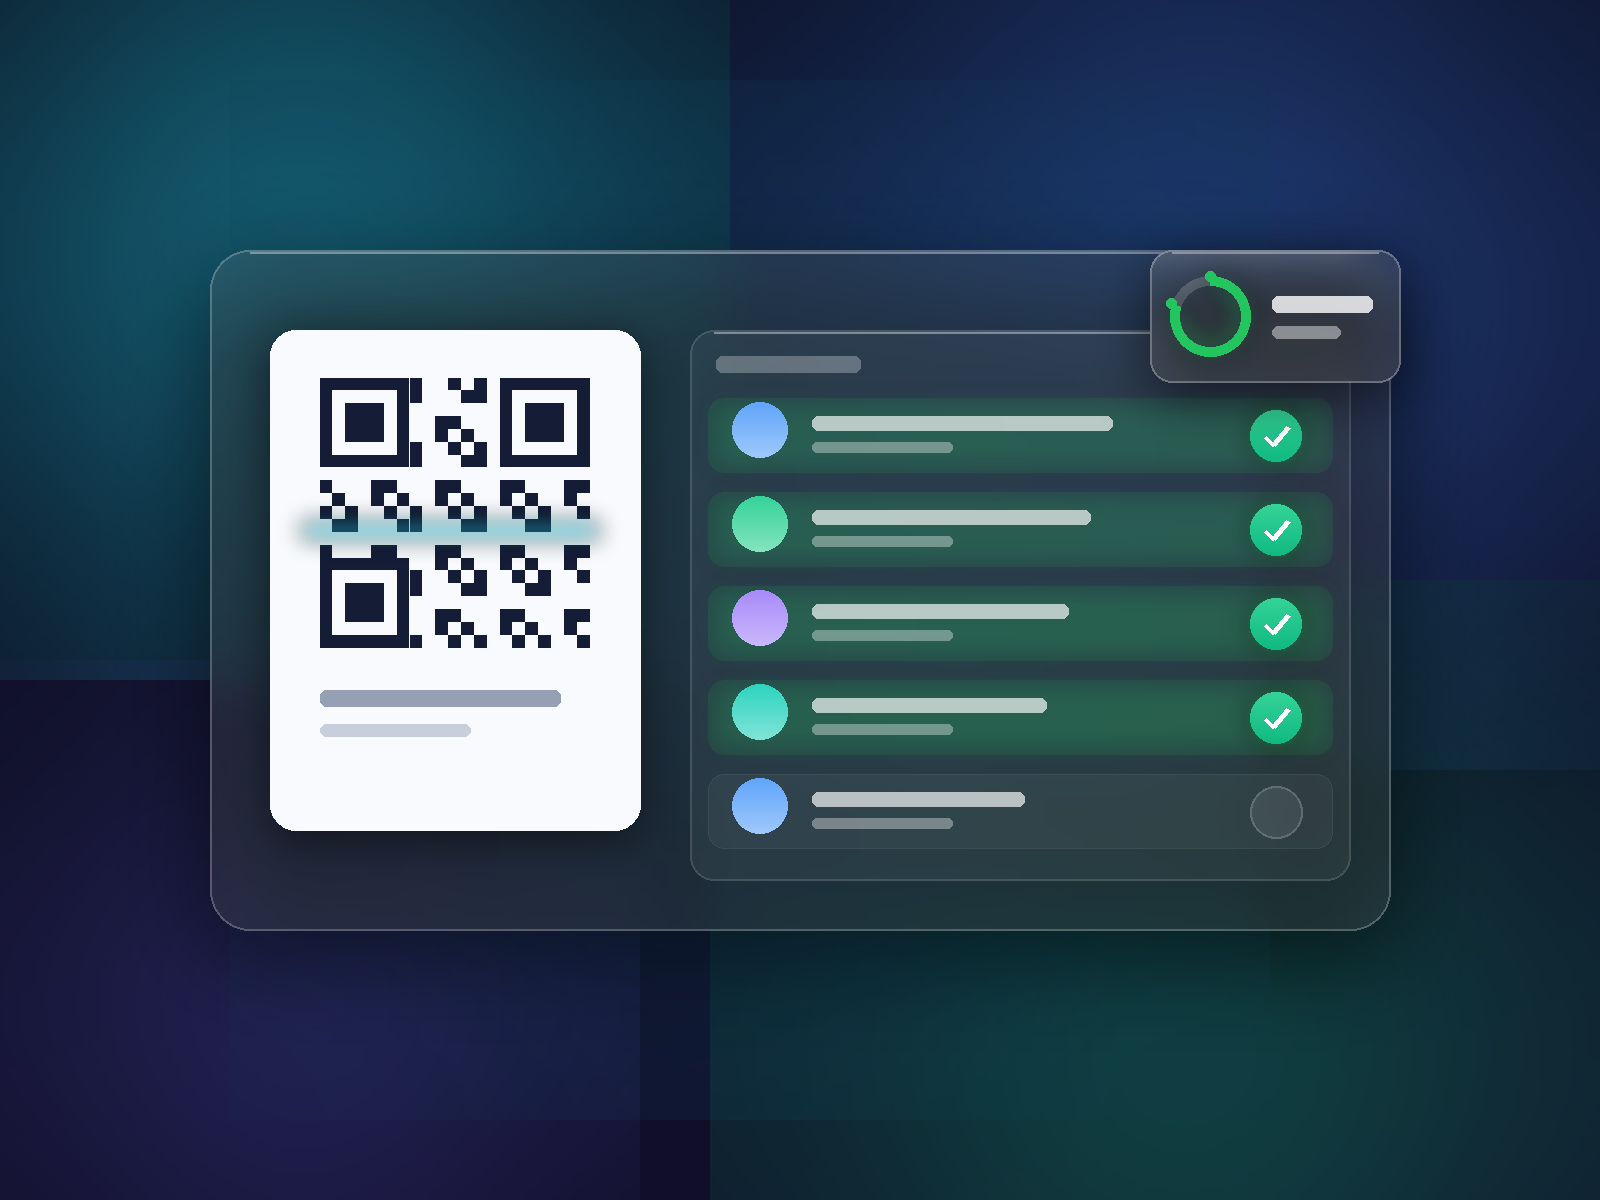
A QR-based smart attendance system — dynamic check-in codes, secure verification, and attendance analytics for classrooms.
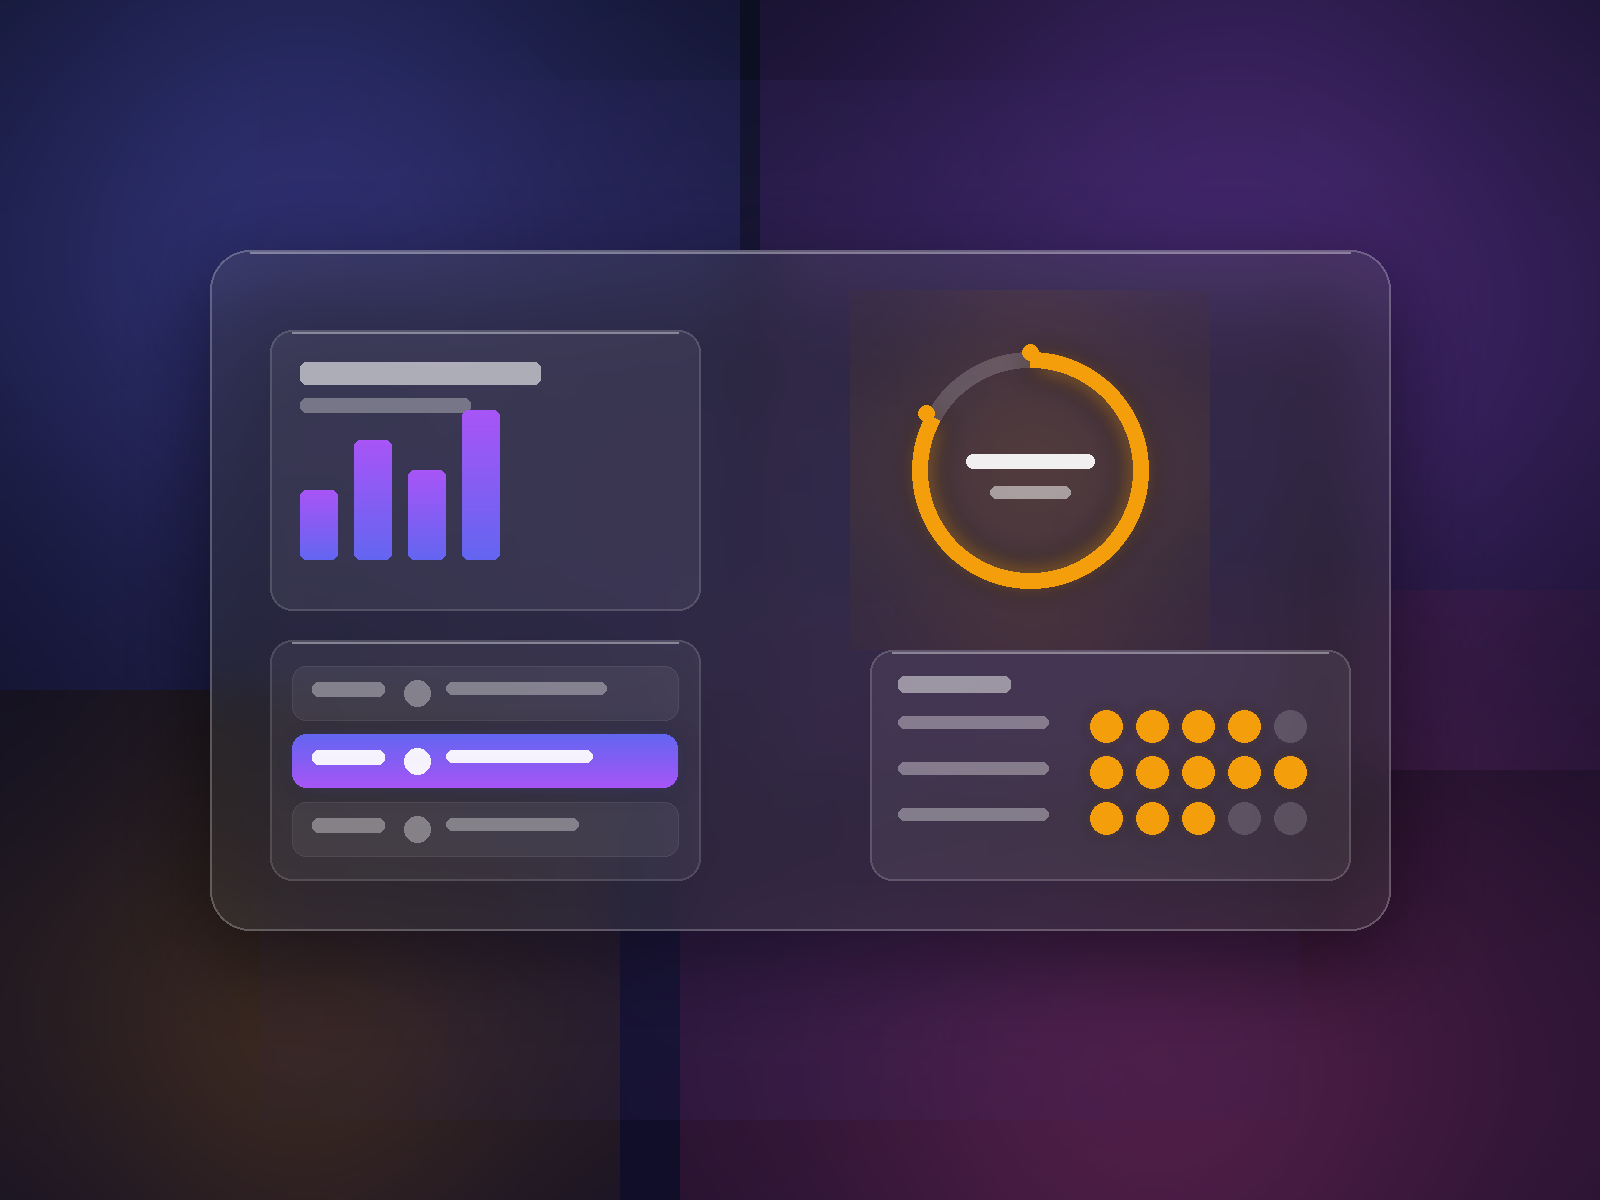
A platform for running student presentations end-to-end — scheduling, submissions, live feedback, rubrics, timing, and analytics.
Enhancing MRI brain images and segmenting tumors with LMMSE, wavelet thresholding, and Fast C-Means.
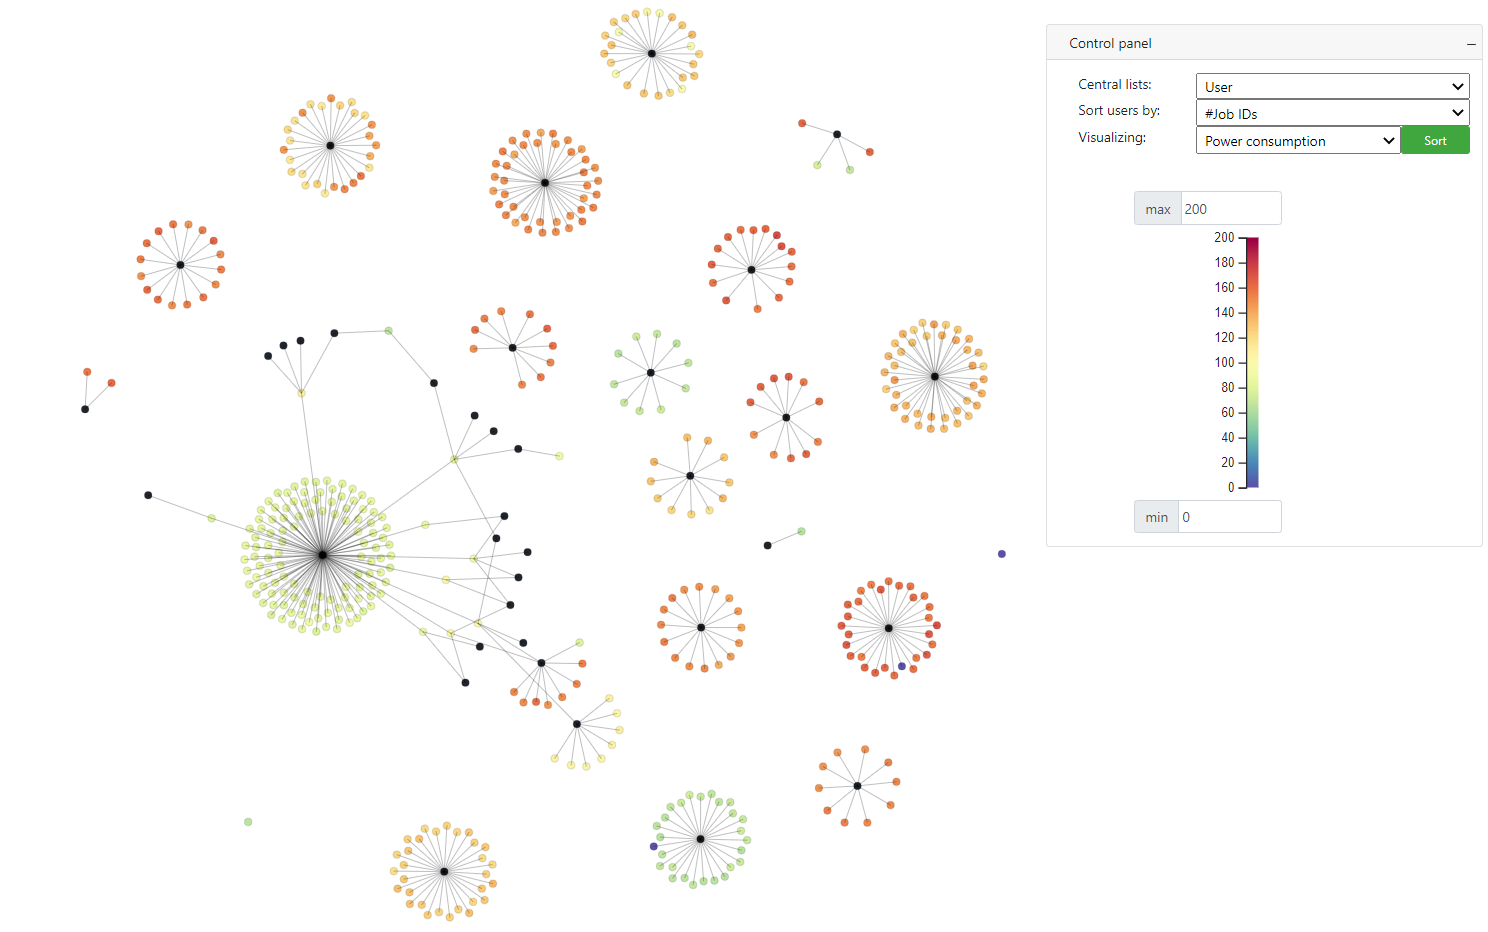
2D & 3D visualization of temporal and structural association in HPC systems.
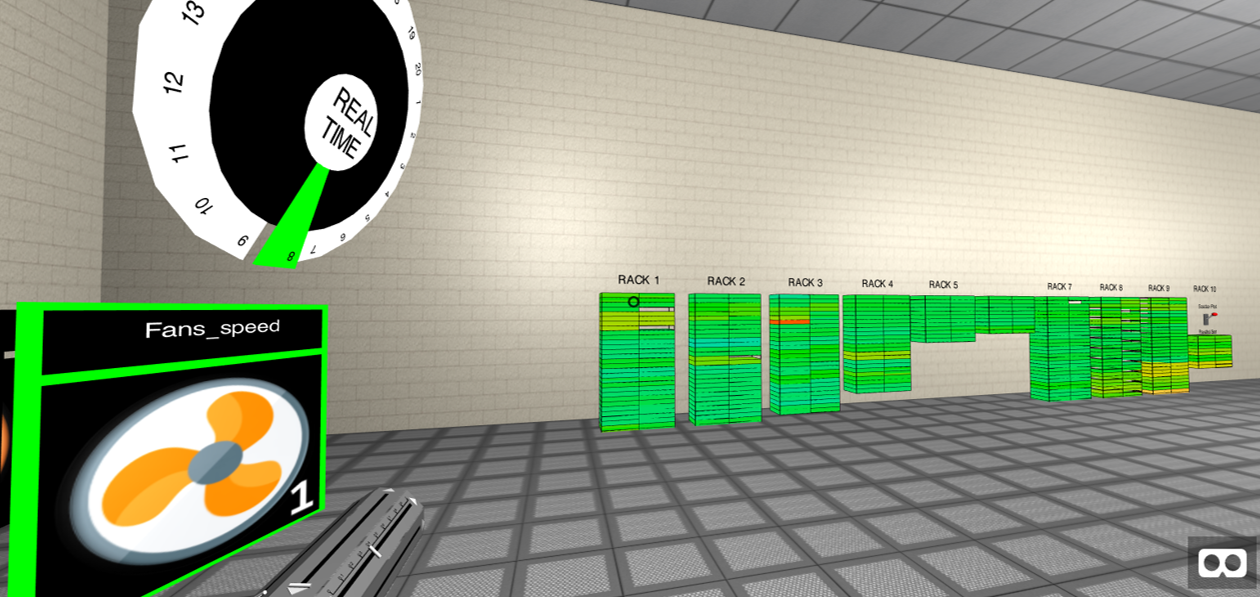
Walking through the multidimensional health of an HPC system in virtual reality.
Surfacing emerging topics in a stream of financial news as they form.
Opening the black box: visual explainability for LSTM models on time series.
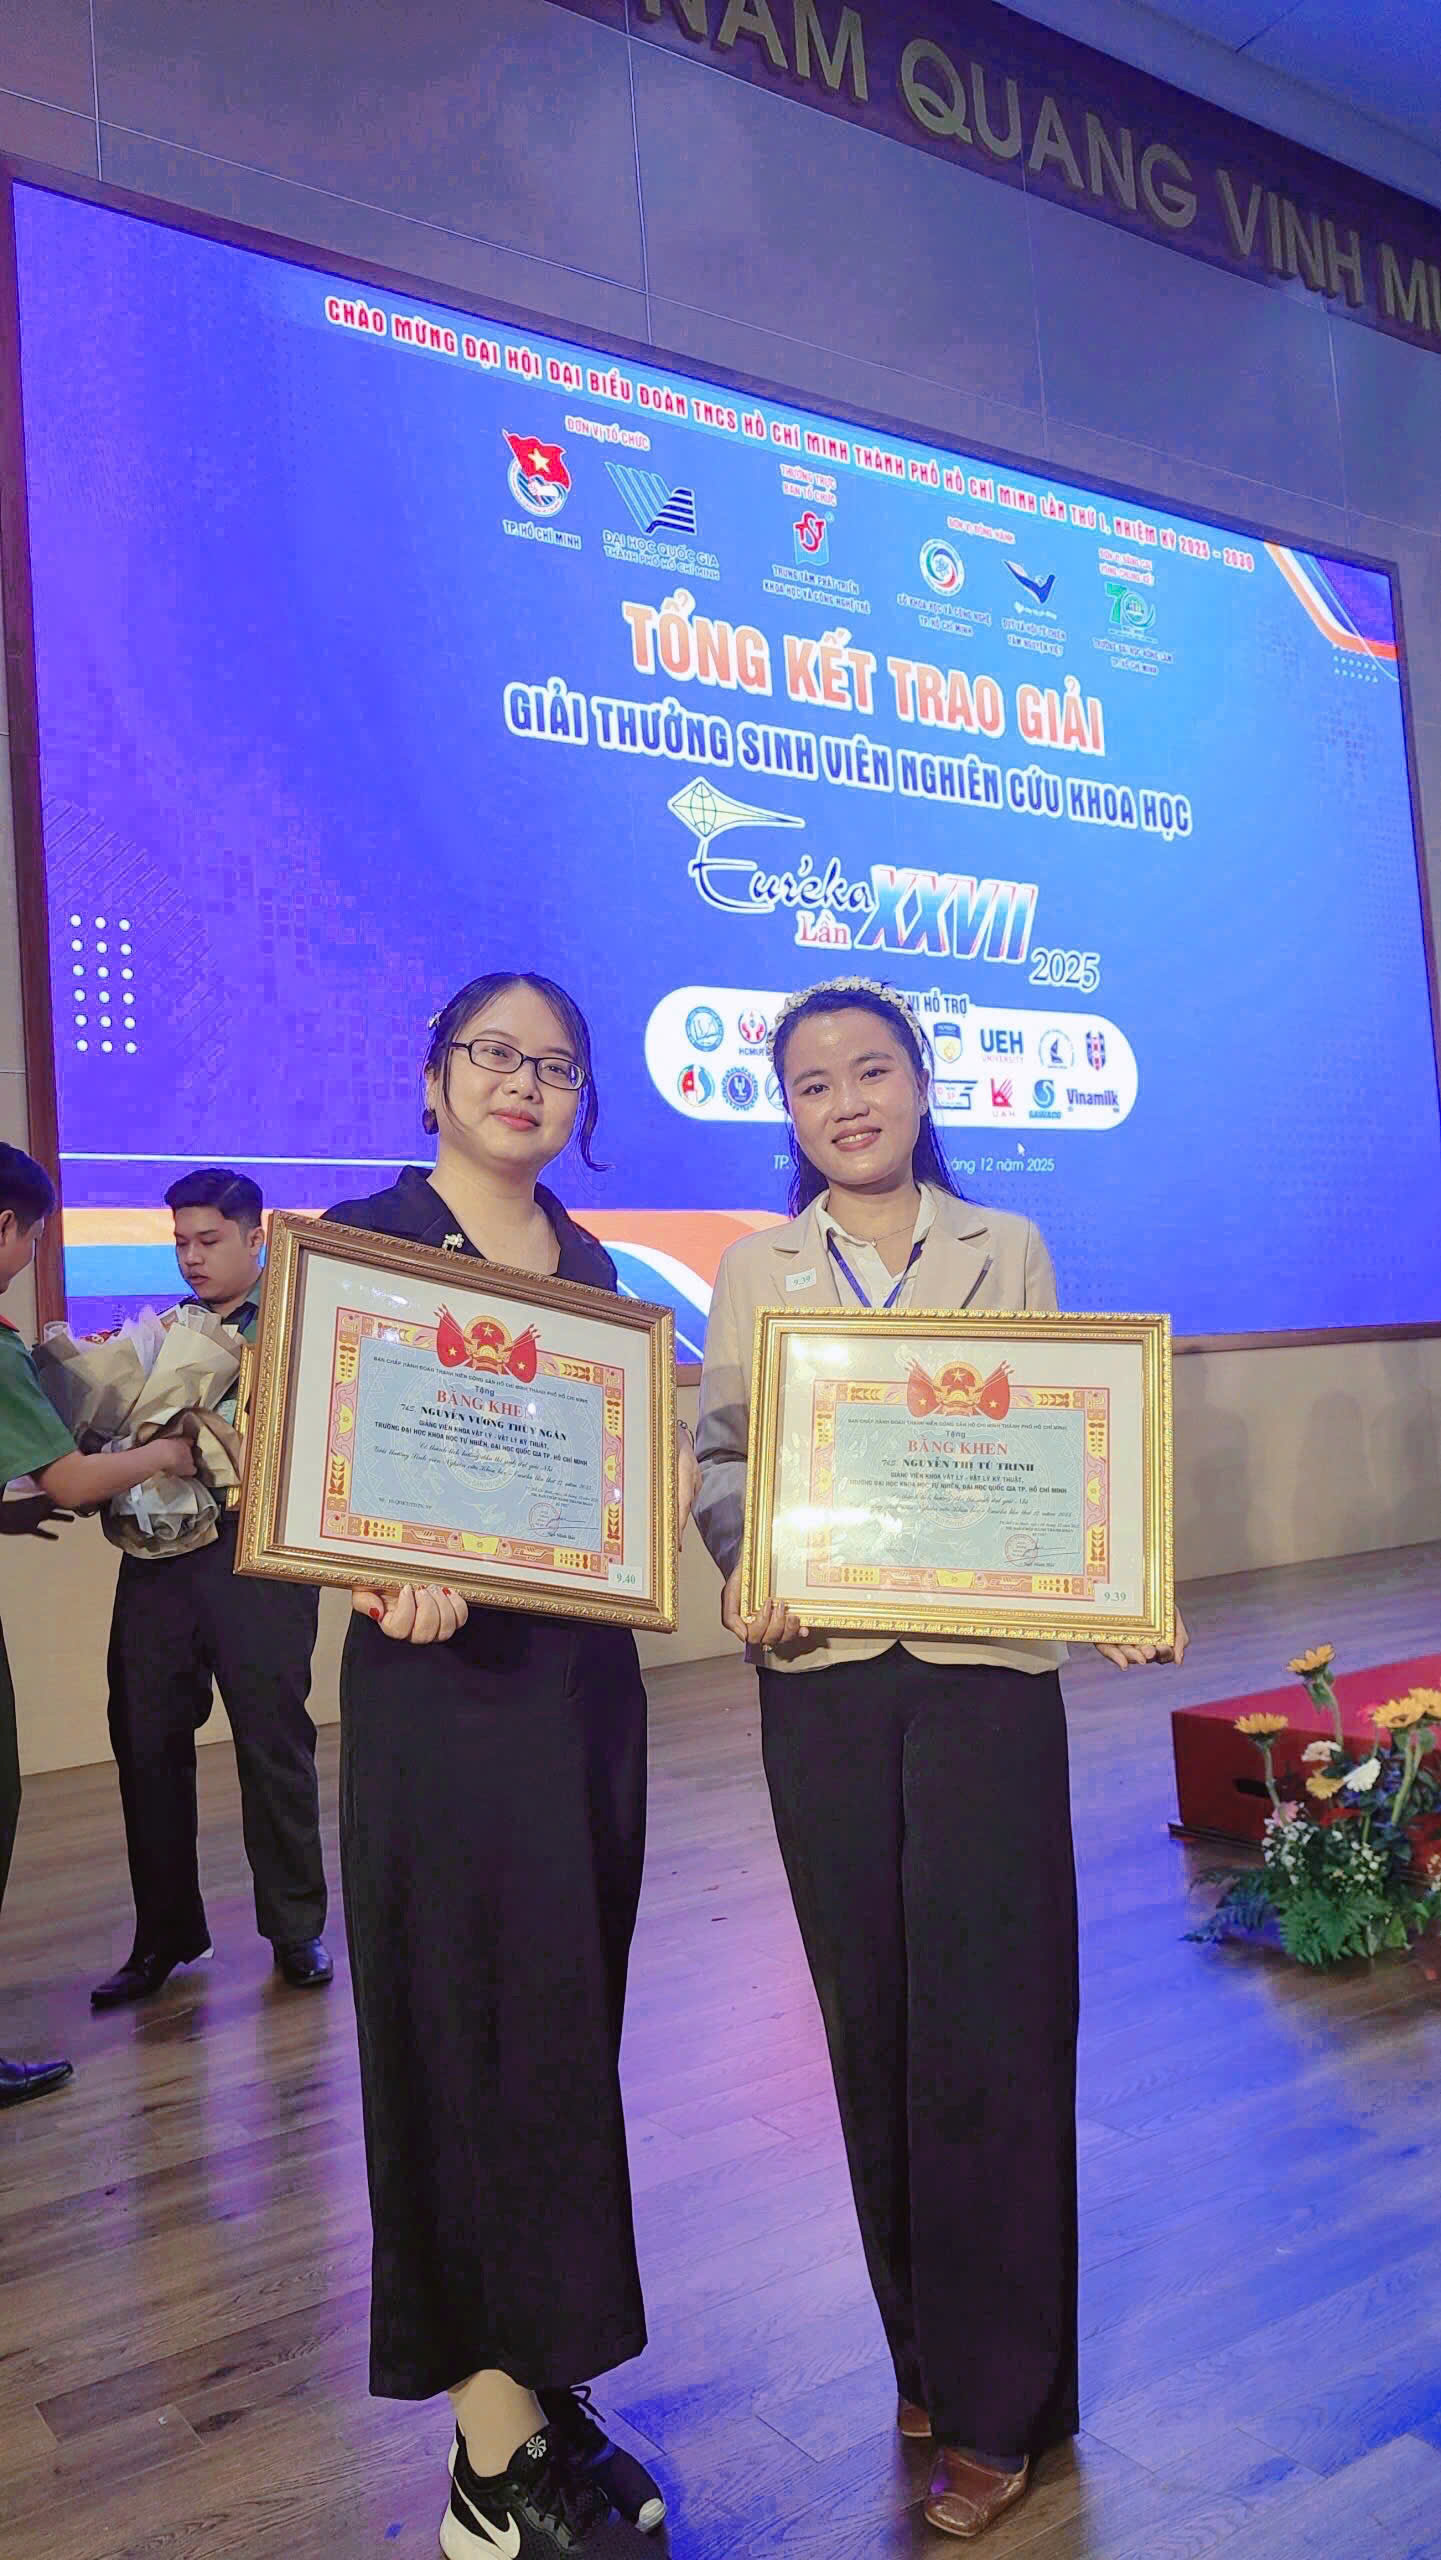
A student team I supervised — taking 2nd place at the national Eureka 2025 with an AR view of a smart city.
The students I supervise and mentor — the people who do the real cutting while I keep the questions sharp.